Explain
EXPLAIN describes how MySQL plans to execute a given query. This is to say that this is
a pre-execution view, not to be confused with profiling a query.
EXPLAIN prints what is considered the best plan after a process of evaluating potentially thousands of ways to execute a query.
There is also a brief insight as to what those other plan choices were under "possible_keys", but in general terms you need to look
at the OPTIMIZER_TRACE for this information.
I recommend always using EXPLAIN FORMAT=JSON, as it provides a query cost (the default format does not). Cost is important, as it makes us think and speak in terms of magnitude. What I mean by this, is I have heard database practitioners say “creating temporary tables are bad” or “joins are bad.” It is hard to respond to these comments directly because they lack vital context; water is bad for you too in sufficient amounts.
As well as running EXPLAIN FORMAT=JSON on a potential query, you can also run EXPLAIN FORMAT=JSON FOR CONNECTION <connection_id> against a running connection to see how it was optimized for execution. This can be useful in diagnosing transient errors as changes to data (and underlying statistics) will influence plan selection.
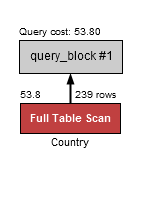
Example 1: Explain showing a table scan operation
EXPLAIN FORMAT=JSON
SELECT * FROM Country WHERE continent='Asia' and population > 5000000;
{
  "query_block": {
   "select_id": 1,
   "cost_info": {
   "query_cost": "53.80"            # This query costs 53.80 cost units
   },
   "table": {
   "table_name": "Country",
   "access_type": "ALL",            # ALL is a table scan
   "rows_examined_per_scan": 239,   # Accessing all 239 rows in the table
   "rows_produced_per_join": 11,
   "filtered": "4.76",
   "cost_info": {
      "read_cost": "51.52",
      "eval_cost": "2.28",
      "prefix_cost": "53.80",
      "data_read_per_join": "2K"
   },
   "used_columns": [
      "Code",
      "Name",
      "Continent",
      "Region",
      "SurfaceArea",
      "IndepYear",
      "Population",
      "LifeExpectancy",
      "GNP",
      "GNPOld",
      "LocalName",
      "GovernmentForm",
      "HeadOfState",
      "Capital",
      "Code2"
   ],
   "attached_condition": "((`world`.`Country`.`Continent` = 'Asia') and (`world`.`Country`.`Population` > 5000000))"
   }
  }
}
In Example 1 EXPLAIN is showing that the query will execute as a table scan (access_type ALL) at a cost of 53.80 cost units. There are no possible indexes listed as available, as the possible_keys part of the output is missing (it usually appears under access_type).
The rows_examined_per_scan count is equal to the number of rows in the table (239), which is approximately how many countries there are in the world. It is important to point out that these are estimates and do not need to be 100% accurate, since doing so may impact performance.
The attached_condition means that a filter will be applied when reading the rows: ((`world`.`Country`.`Continent` = 'Asia') and (`world`.`Country`.`Population` > 5000000)). It is possible that with indexes these attached_conditions could be satisfied before reading the rows, but alas being listed here means that is not the case.
I like to compare the rows_examined_per_scan to the number of rows sent to the client when the query is executed [1]. Rows sent is not available until the query is executed, and by executing the query I can see the number is 32. This means that this query is examining 7.5x more rows than it is sending, which hints that optimization may be possible [2] .
As a reminder, it is important to mention that 239 rows in total is not large, and all rows will fit in memory. But table scans have performance characteristics that demand high memory fit, and symptomatically performance may appear to fall off a cliff as the tables become larger. Adding indexes helps both improve performance, and keep it consistent as data grows.
| [1] | This information is also available in performance_schema.events_statements_history_long. |
| [2] | A very small ratio (even 1:1) does not indicate that optimization is not possible. For point lookups there are still opportunities for optimizations such as partitioning or changing page sizes. |